Measuring particulate matter with the PMS5003
This article details how I used the Plantower PMS5003 particulate matter (“PM”) sensor on a PC or laptop, using an FT232H breakout board to make the connection.
Introduction
My reasons for buying this device are so that I can measure airborne particulate matter at home and at work. So I can answer the questions how dusty my environment is at home and at work.
Hardware
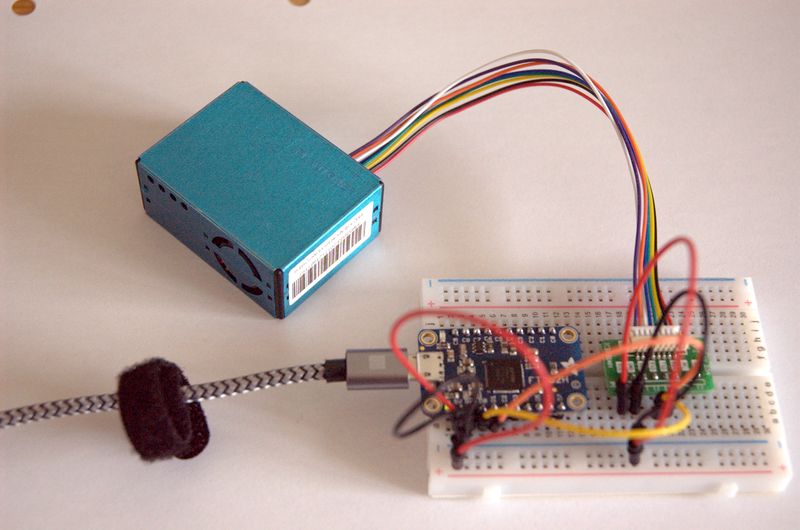
Apart from the PMS5003 which I ordered as a kit from adafruit, I also used a serial to USB converter in the form of an FT232H breakout board.
The reason for using this specific serial ↔ USB board is that it also supports I²C and SPI. So I can can use it to connect sensors directly to my PC without needing a ESP32, pyboard or Arduino in between. But that will be a different article. :-)
Both boards were pushed into a solder less breakout board and connected with some jumper wires. I wired both the transmit and receive lines of the PMS5003, for reasons that shall become apparent later.
To use the sensor I had to read the manual but also look at e.g. the adafruit sample code because some points were not completely clear to me from the documentation. In the process I made some annotations in the manual. Since there don’t seem to be restrictions to modifications and redistribution of that manual, I’ve made my annotated version available.
Software
The FT232H chip is supported in FreeBSD by the uftdi(4) driver. It is
visible as a tty device, /dev/cuaU*. In Python I use the pyserial library
to communicate with this board.
For these kinds of things, Python 3 is my default language. It might be doable as a shell script, but that would be more complicated then I’d like. Writing it in C would definitely be overkill.
As usual, the script that I wrote for data-logging is available on github. It is pretty simple; it reads data from the sensor at specified intervals, and writes these to a log file as plain text. See below for an example and explanation of the format.
Modes
The PMS5003 has two modes, active and passive. In active mode in continuously pushes out measurements. This is the default mode when the device starts. Passive mode means that data is only sent out when you send a request for data to the device.
Initially I used active mode. So I only had to connect the transmit line from the sensor to the receive pin of the FT232H. But at least on the sensor I have, this runs into problems. After several hours of operation, the data packets start having checksum errors and the data values change so much as to become unbelievable. This happened several times. The code that I used for these measurements recorded the value every five seconds. When a checksum error occurs, it measures again immediately, because occasionally it was just a single faulty reading. More often the readings would stay garbled.
In the below excerpt from the data-file around the point of the change the environmental PM counts and raw particle counts are shown:
2018-04-13T10:13:34Z 10 17 18 1980 573 100 12 0 0
2018-04-13T10:13:39Z 10 17 18 2022 584 106 10 0 0
2018-04-13T10:13:44Z 10 17 18 1998 569 110 10 0 0
2018-04-13T10:13:49Z 10 17 18 2046 569 108 12 2 0
2018-04-13T10:13:54Z 10 16 18 2025 554 104 10 2 0
2018-04-13T10:13:59Z 10 17 18 2097 575 114 8 2 0
2018-04-13T10:14:04Z 9 16 17 2079 575 112 8 2 0
2018-04-13T10:14:09Z 9 16 18 2046 573 116 12 4 0
2018-04-13T10:14:14Z 9 16 18 2046 573 116 12 4 0 # checksum mismatch
2018-04-13T10:14:14Z 2304 3840 3847 17410 1536 25088 1024 0 151 # checksum mismatch
2018-04-13T10:14:14Z 2304 3840 3847 17410 1536 25088 1024 0 151 # checksum mismatch
2018-04-13T10:14:14Z 2560 4096 4103 48130 8448 26624 1024 0 151 # checksum mismatch
2018-04-13T10:14:14Z 2560 4096 4103 48130 8448 26624 1024 0 151 # checksum mismatch
2018-04-13T10:14:14Z 2560 4096 4103 48130 8448 26624 1024 0 151 # checksum mismatch
2018-04-13T10:14:14Z 2560 4096 4104 1794 11520 26624 1024 0 151 # checksum mismatch
2018-04-13T10:14:14Z 2560 4096 4104 1794 11520 26624 1024 0 151 # checksum mismatch
2018-04-13T10:14:14Z 2560 4096 4104 1794 11520 26624 1024 0 151 # checksum mismatch
The first item on each line is the combined date and time in ISO-8601 format. Next are the PM1.0, PM2.5 and PM10 values in μg/m³. The remaining numbers are particle counts per 0.1 dm³ for the particle sizes >0.3 μm, >0.5 μm, >1.0 μm, >2.5 μm, >5 μm and >10 μm.
A hard reset (removing the USB cable) restores the function of the device. I have not tried using the reset pin.
So I changed my program to use passive mode. This means that the sensor only sends data over when you send it a request to do so. In order to do that, I also wired the transmit pin from the FT232H to the receive pin of the PMS5003. I’ve run this modified program (logging data every five minutes) overnight without issues. So it seems to me that passive mode is more reliable. But it could also be an issue with my particular sensor. Or with the serial driver. One thing I could do is hook the sensor (in active mode) up to my pyboard and see if that produces the same issue. But that, again, will have to wait for a future article.
Results
After leaving the sensor running for around 48 hours, this is what I’ve measured.
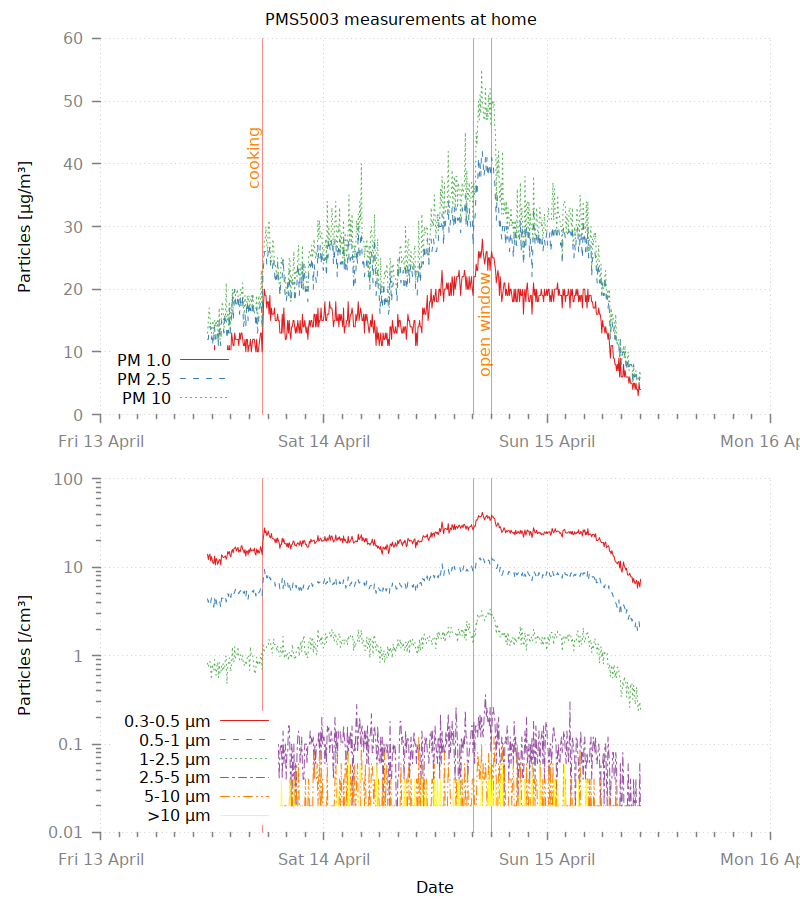
The spike in fine particulates in the evening of the 13th is me cooking dinner. The following day I opened the window for an hour or two. These events correlate nicely with spikes in the amount of PM. In the night from Saturday to Sunday is rained, which seems to have “washed” the particulates out of the air.
For PM 1.0 the average is 15.6 μg/m³, the median is 16 μg/m³ the maximum is 28 μg/m³. For PM2.5 the average is 23.5 μg/m³, the median is 24 μg/m³ the maximum is 42 μg/m³. For PM 10 the average is 26.5 μg/m³, the median is 27 μg/m³ the maximum is 55 μg/m³. On average, there are 21.08 particles 0.3−0.5 μm, 7.02 particles 0.5−1 μm, 1.37 particles 1−2.5 μm, 0.09 particles 2.5−5 μm, 0.02 particles 5.0−10 μm, and 0.01 particles >10 μm in every cm³ of air in my house.
The code to produce these numbers is simple:
import numpy as np

columns = np.genfromtxt('example.d', comments="#", delimiter=" ",
                        usecols=tuple(range(1, 10))).T

# Every of these columns is particulate matter < X/10 μm in μg/m³.
pm10 = columns[0]
pm25 = columns[1]
pm100 = columns[2]

# Every of these columns is a count of particles > N/10 μm in 0.1 dm³ or air.
part03 = columns[3] - columns[4]
part05 = columns[4] - columns[5]
part10 = columns[5] - columns[6]
part25 = columns[6] - columns[7]
part50 = columns[7] - columns[8]
part100 = columns[8]

for name, data in (('PM 1.0', pm10), ('PM2.5', pm25), ('PM 10', pm100)):
    ln1 = 'For {} the average is {:.1f} μg/m³, the median is {:.0f} μg/m³'
    print(ln1.format(name, data.mean(), np.median(data)), end=' ')
    print('the maximum is {:.0f} μg/m³.'.format(data.max()))

print('On average, there are', end=' ')
for name, data in (('0.3−0.5 μm', part03), ('0.5−1 μm', part05), ('1−2.5 μm', part10),
                ('2.5−5 μm', part25), ('5.0−10 μm', part50)):
    print('{:.2f} particles {},'.format(data.mean()/100, name), end=' ')
ln2 = 'and {:.2f} particles >10 μm in every cm³ of air in my house.'
print(ln2.format(part100.mean()/100))
The daily averages for PM2.5 and PM10 are below the current limits in Europe. I’ll have to do some measurements outside and on different days to see how good or bad those measurments are. I might have to dust my house more often. :-)
As witnessed by the delayed effect of the rain on the PM concentration inside the house, it seems likely that the PM concentration in my house follows that of the outside air due to ventilation. Also of note is that the effects of a disturbance (like cooking, or an open window) fade after a couple of hours.
The particle counts are combined into bins in the graph above. Most of the particles are greater than 0.3 μm and smaller than 2.5 μm.
It is spring here at the moment, so I would expect to find pollen. But the size of pollen grains is generally >6 μm and up to 100 μm. In I don’t see much in that size range.
For comments, please send me an e-mail.
Related articles
- Profiling Python scripts(6): auto-orient
- Profiling with pyinstrument
- From python script to executable with cython
- On Python speed
- Python 3.11 speed comparison with 3.9