Using gnuplot from Python
According to my revision control systems (rcs in those days), I’ve been
using gnuplot to make graphs since at least 2002. And I’ve got it set up via
a custom gnuplotrc to match the style of the TeX documents I often use the
graphs in.
At work we have an Instron 3369 machine for material testing. Recently, I wanted to visualize some tensile test data in ways that I couldn’t get into the test report.
The “Bluehill” software that controls the Instron machine outputs results in different formats. Natively, it produces a binary blob and UTF-16 encoded XML. With some open-source (xmllint and unidecode) I could read that as shown below.
xmllint --format getalit-05.is_tens | unidecode -e UTF-16 | less
This is somewhat readable and contains all the settings and results as far as I can tell. However, I consider XML a pain in the ass to work with and will use it only when no other alternatives exist.
Fortunately, I had also instructed the software to save the data in csv
format. The summary was saved in a file with the extension
<testname>.is_tens_Results.csv, while the raw data was saved in files in
a subdirectory <testname>.is_tens_RawData/Specimen_RawData_<N>.csv, where
<testname> is the name you have given the test, and <N> is the
specimen number.
The contents of the is_tens_Results.csv file contain whatever data you
instructed the program to save. In this case, I saved (among other things) the
Young’s modulus and the breaking stress of tensile test samples. I didn’t
explicitly save the breaking strain, so I calculated that from the modulus and
breaking stress.
Data from six different tests has to be gathered and plot in a single graph.
To facilitate this, I made tuples of file numbers and labels describing the
samples. But first the subprocess module is imported to use later.
import subprocess

combinaties = (('01', 'gedroogd, lengte, 0,5 mm'),
            ('02', 'onbehandeld, lengte, 0,5 mm'),
            ('03', 'benat, lengte, 0,5 mm'),
            ('04', 'gedroogd, breedte, 0,5 mm'),
            ('05', 'onbehandeld, breedte, 0,5 mm'),
            ('06', 'benat, breedte, 0,5 mm'))
Next I defined some format strings that I will use later, and a translation dictionary.
fn = 'getalit-{}.is_tens_Results.csv'
pl = '"-" with points ls {} title "{}",'
tr = {ord('"'): None, ord('.'): None, ord(','): '.'}
The commands for gnuplot will be defined as a list of strings.
gpcmds = ['set terminal pdfcairo enhanced color dashed '  # Single line, no comma!
        'font "Alegreya, 11" '  # Single line, no comma!
        'rounded size 12.8 cm, 7.0 cm',
        'set xlabel "ε [%]"',
        'set ylabel "σ [MPa]"',
        'set key right bottom',
        'set xtics 0.1',
        'set output "overzicht-trektesten.pdf"']
Note how the first two lines have no trailing comma. The first three lines should be one line for gnuplot!
Separate lists will be used for the actual plot commands (since they too should be on one line) and the inline data.
gpplots = ['plot']
gpdata = []
Next comes the heart of the script; the loop for reading and processing the data.
for num, (k, v) in enumerate(combinaties, start=1):
    try:
        with open(fn.format(k), encoding='ISO8859-1') as datafile:
            lines = datafile.readlines()
        data = [ln for ln in lines if ln[0] in '0123456789']
        specimendata = []
        for ln in data:
            ln = ln.translate(tr).split(';')
            E, σ = [float(n) for n in ln[1:3]]
            ε = σ/E*100
            specimendata.append('{:.5f} {:.2f}'.format(ε, σ))
        specimendata.append('e')
        gpplots.append(pl.format(num, v))
    except FileNotFoundError:
        pass  # Skip this file
    else:
        gpdata += specimendata
gpplots[-1] = gpplots[-1][:-1]  # Remove ','
gpcmds.append(' '.join(gpplots))
gpcmds += gpdata
gpcmds = '\n'.join(gpcmds)
First the data is read into lines. The lines of data that matter have the following format (presumable because this software was configured for a Dutch locale where the comma is used as the decimal separator):
2;"8.741";"76,11";"896";"100";"0,58";"20,3";"11,77"
They start with a number, then contain values in double quotes separated by semicolons and using a decimal comma and a point as the thousands separator. The first number is the specimen number. The second number is the Young’s modulus and the third number is the tensile stress.
After reading all the lines in the file, we restrict the data to those lines
that start with a number. This format is still not suitable for parsing,
so I use a custom translation (the tr dictionary shown earlier).
In short, this translation removes the quotes and the full stops used as
thousands separators and replaces the decimal comma’s with decimal points.
After the translation the string is split on the semicolons. The Young’s
modulus (E) and breaking stress (σ) are extracted from the data. After that,
the breaking strain (ε) is calculated. This takes advantage of the ability of
Python 3 to use Unicode identifiers. The strain and stress are formatted as
a string which is finished with a line containing just an e and then
appended to the specimendata list. Once a file has been successfully
processed, the specimen data are added to the total data list. A line for
plotting this data is appended to the gpplots list.
Once all the data has been processed, the comma at the end of the last
gpplots string is removed, and all the commands are join-ed with
spaces. The resulting string is appended to the gpcmds list. The last
addition to gpcmds is the total gpdata list. Finally, gpcmds is
converted into a string by joining the lines with a newline.
# Write gnuplot commands to a file for debugging
with open('overzicht-trektesten.gp', 'w') as gpfile:
    gpfile.write(gpcmds)

# Run gnuplot
p = subprocess.run(['gnuplot'], input=gpcmds.encode('utf-8'))
if p.returncode != 0:
    print('gnuplot failed with error code', p.returncode)
To aid in debugging, the complete list of gnuplot commands is written to a file.
Finally, the gnuplot commands are encoded as UTF-8 and provided to the
standard input of a gnuplot process, which produces a PDF file. An image
of the graph in shown below.
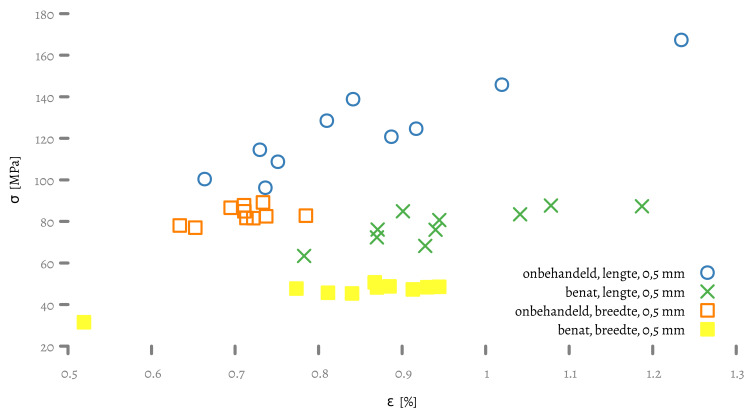
Note that the styles are not gnuplot‘s defaults. The line styles are from
set1.pal from the gnuplot-palletes repository.
For comments, please send me an e-mail.
Related articles
- Profiling Python scripts(6): auto-orient
- Profiling with pyinstrument
- From python script to executable with cython
- On Python speed
- Python 3.11 speed comparison with 3.9