Mapping a property boundary
From a walden effect article on mapping property boundaries I learneed that at least in the US, properties are described as walks from point to point. The walks are given in compass degree headings and distances.
You can work out how to plot this on a piece of graph paper, but hey, that’s what computers are for! So I wrote the following program to plot a property boundary from the data given in a deed.
For the purpose of this calculation the earth’s surface is considered to be flat. Unless your property is huge, this isn’t much of a stretch, since the equatorial radius of the earth is approximately 6378 km! If your property is 1000 m across, the height difference from a flat plane is around 2 cm. So this calculation is not perfect, but it’s close enough.
The formula for calculating the area of a polygon comes from the website of Paul Burke.
#!/usr/bin/env python
'''Plot a property given in the deedpoints list'''
import math
import matplotlib.pyplot as plt
from matplotlib.path import Path
import matplotlib.patches as patches
deedpoints = [
('N', 63, 18, 0, 'E', 1401.09),
('N', 73, 53, 0, 'E', 130.43),
('N', 88, 59, 50, 'E', 90.59),
('S', 20, 25, 50, 'E', 259.96),
('S', 15, 26, 50, 'E', 345.25),
('S', 19, 43, 50, 'E', 96.51),
('S', 22, 46, 40, 'E', 200.39),
('S', 28, 12, 50, 'E', 110.44),
('S', 34, 47, 40, 'E', 277.66),
('S', 44, 43, 40, 'W', 106.84),
('S', 63, 54, 20, 'W', 323.67),
('S', 38, 19, 20, 'E', 281.68),
('S', 22, 58, 10, 'W', 365.59),
('S', 80, 5, 40, 'W', 438.65),
('N', 51, 49, 40, 'W', 527.88),
('S', 50, 23, 10, 'W', 98.67),
('N', 49, 0, 20, 'W', 95.73),
('N', 72, 42, 10, 'W', 429.41),
('N', 14, 22, 20, 'W', 924.64),
]
verts = [(0.0, 0.0)]
codes = [Path.MOVETO]
for d in deedpoints:
angle = d[1]+d[2]/60.0+d[3]/3600.0
direction = d[0] + d[4]
if direction == 'NE':
angle = 90.0 - angle
elif direction == 'NW':
angle = 90.0 + angle
elif direction == 'SE':
angle = angle - 90.0
elif direction == 'SW':
angle = 360 - (90 + angle)
else:
raise ValueError('Invalid direction')
angle = math.radians(angle)
dx = d[5]*math.cos(angle)
dy = d[5]*math.sin(angle)
prev = verts[-1]
newpoint = (prev[0] + dx, prev[1]+ dy)
verts.append(newpoint)
codes.append(Path.LINETO)
path = Path(verts, codes)
fig = plt.figure(None, (5,5), 300) # 5x5 in, at 300 dpi
ax = fig.add_subplot(111)
ax.set_aspect('equal')
patch = patches.PathPatch(path, facecolor='orange', lw=2)
ax.add_patch(patch)
ax.set_xlim(-200,2300)
ax.set_ylim(-1500,1000)
plt.grid()
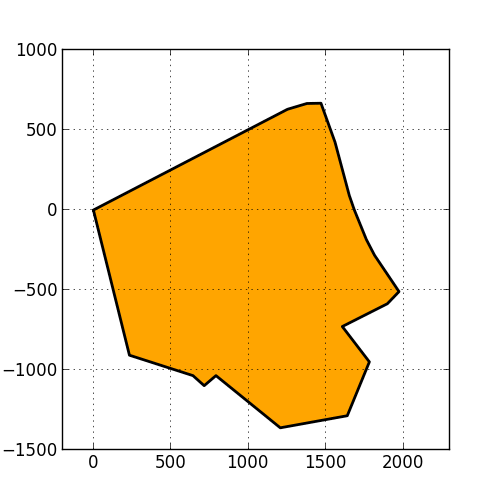
plt.savefig('property.pdf')
This results in the following image.
For comments, please send me an e-mail.
Related articles
- Creating a rectangular tube in CalculiX
- Meshing a circle with hex elements in CalculiX
- Python bindings for libmagic
- Modifying pelican
- Updating the site generator “pelican” to 3.5.0